|
11/24/2014 7 Comments Infographics for Education
In this fast-paced world of instant access to information, infographics have become popular for displaying statistics and facts.
Take advantage of this trend to give your students a great visual tool! After seeing this format of informational displays all over pinterest, I noticed that most of the available infographics were used persuasively. I saw plenty of environmental and political data as well as great stats for a wide variety of topics. I decided to start putting together some educational infographics that could be used in the classroom to display content. Math students LOVE having these as a reference. They are so helpful for my visual learners.
I have also collected some sites and tools that will help you and your students to develop some great infographics and start taking advantage of this idea right away!
Student-Created Infographics
One way to incorporate infographics into your classroom is to assign your students a short project in which they develop their own infographic. This works great in any subject area and is a great way to integrate technology education into your curriculum. You can offer this as one option when you differentiate using a choice board or you can require all students to make an infographic.
You can give a very specific list of what must be included within the topic or allow students a little more freedom. Here are a few samples:
Here are some sites and tools that your students can use: * Piktochart (a free tool for designing infographics) * Easel.ly (a free tool for original content) * Classroom Clipart (free images for students to use) Note: These are NOT for commercial use. Please make sure each is appropriate for your students and grade level before using. Teacher-Created Infographics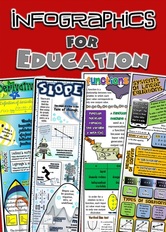
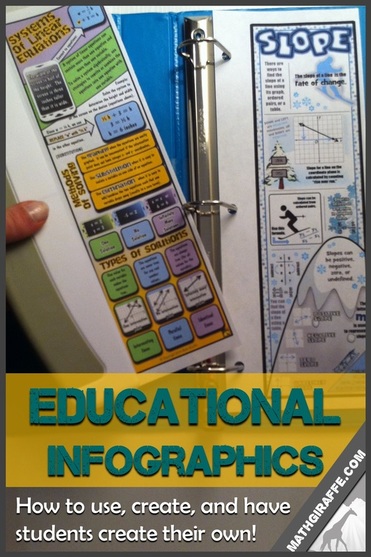
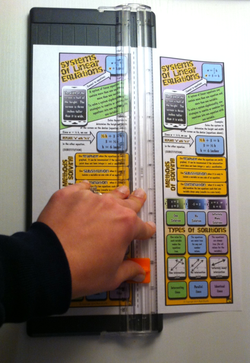
Another option is to create an infographic yourself and print it for students.
You can place any information that you feel is most important for them to remember about each topic. Students really love having these as study guides. They can remember the concepts because they can visualize the way that the infographic presented the information.
Click here to visit my "Infographics" category within my store. They are available for just a dollar, which entitles you to unlimited printing for all of your students FOREVER! Check them out or have fun creating your own!
I leave a space on the left of each tall half-page, so we can easily 3 hole punch them for binders. 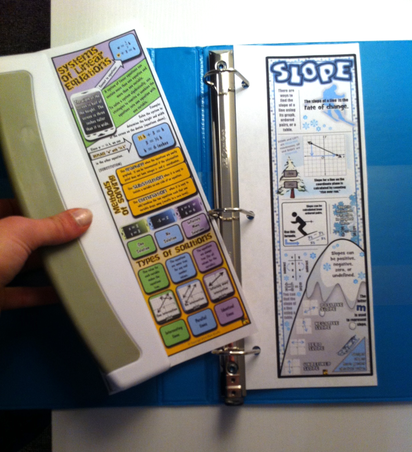
For more ideas, updates, and free resources, subscribe by entering your email in the sidebar.
To Read Next:
7 Comments
Chandra
7/10/2018 04:57:27 pm
I am a 5th grade and would really love to use this. Need all the help I can get to incorporate. Thanks for your assistance.
Whitney Olvey
4/4/2019 08:43:31 pm
Thanks for all of your great tips and ideas! My kiddos LOVE doodle notes! 4/5/2019 02:00:32 pm
Hi Whitney,
Rabee
1/9/2023 07:12:04 am
Hi, I am the 9th grade math teacher. I really liked your content and the way you made infographics. It was great. Good luck. I hope I can make it and teach it to my students, of course I believe I can learn from them.
The Pubnix environment embodies the original spirit of the Internet and Unix culture, which is all about openness, sharing knowledge, and community-driven development. For someone who's spent a significant amount of time on various Pubnix servers, I can vouch for the sense of community and the wealth of learning opportunities they offer. It's a fantastic way to dig deep into Unix, practice shell scripting, or even contribute to community projects. Plus, interacting with like-minded individuals who appreciate the beauty of a command-line interface is incredibly refreshing. 7/3/2023 07:57:57 pm
Essay writing is an art, a confluence of ideas, perspectives, and voice that paints a vivid picture for the reader. It's a way for writers to not just express themselves, but also to invite readers into their world of thought. With the rise of AI technology, this art form is evolving. 'The Best AI Essay Writers' have truly redefined what's possible, crafting essays that embody intellectual depth, creativity, and nuance with unparalleled precision. These AI essay writers showcase a unique blend of human-like understanding and technological consistency, transforming the landscape of written expression. It's fascinating to see how seamlessly AI can mirror the depth and quality of human thought in their writings. 2/28/2024 10:17:28 am
Great insights in the 'Math Giraffe' blog post on using learning stations in middle school! Implementing such interactive and structured learning methods can significantly enhance student engagement and understanding. Speaking of effective learning strategies, WritePapers.com offers excellent academic assistance, including help with term paper, educational strategies and assignments. Their expertise can be particularly beneficial for educators looking to develop impactful teaching materials and for students seeking guidance in academic writing. Check out their services at WritePapers.com for more on how they can support your educational journey. Leave a Reply. |
Archives
December 2023
Click to set custom HTML
|

 RSS Feed